Forex Chart Patterns: How to Read Forex Trading Patterns
Jan 03 2025
Forex patterns are visual representations of price changes that can be used to help predict the direction of future movements. Patterns are vital for forex traders as they help people time trades and make well-informed decisions.
Several types of forex chart patterns exist, each indicating various things, including current/upcoming trends, potential reversals, continuations to the current trend, and market sentiment (how people feel about an asset or market).
Understanding How Forex Chart Patterns Work
There are a few different types of forex trading patterns to be aware of:
- Reversal forex patterns signal traders that a potential change to the current trend could occur. For example, a pattern showing a bullish (upward) reversal would indicate the possible end of a downward trend.
- Continuation patterns tell traders that a trend could continue. For example, an asset may continue falling if a forex pattern shows a continuation in a downward market.
- Neutral patterns represent a pause in price movement but offer no information on the direction.
Taking the time to learn about chart patterns and understand their significance is crucial. Traders can use them to improve performance and win rate. They are most effective when used alongside technical indicators like the Relative Strength Index (RSI) and other analytical tools.
Essential Reversal Chart Patterns
Reversal patterns in forex are a type of chart formation that indicates an asset's direction is likely to change. They signal the end of the current trend and the beginning of a new one.
Head and Shoulders
The head and shoulders forex pattern is a chart formation well-known amongst traders. It signals that a bullish market is about to turn bearish. However, the inverse head and shoulders pattern indicates the opposite.

The pattern is formed when an asset's price rises, falls back to its pre-move level, and rises higher than the previous move before falling and rising to a similar level as the first move.
Double Top and Double Bottom
The double top/bottom forex chart patterns signal traders that a medium to long-term trend could reverse.
A double top is formed when the price of an instrument rises to a high twice, with a decline in between. Double top forex patterns are strongly bearish.

The double bottom or forex W pattern is the opposite. It's bullish and is formed when the price drops to two lows but experiences a moderate rise in between.
Triple Top and Triple Bottom
The triple top/bottom forex trading patterns signal a strong reversal could occur. They are long-term patterns that often take roughly three to six months to form.

A triple top is a bearish pattern created when the price of an asset rises to a peak before falling three consecutive times. Likewise, a triple bottom is a bullish pattern formed when the price drops to a low before rising to roughly the same level three times.
Essential Continuation Chart Patterns
Continuation forex trading patterns represent a pause in a fast-moving market. They typically occur following a quick, significant move. After staying in a range for a period, assets displaying a continuation forex pattern continue moving in the trend's original direction.
Pennant and Flag
A pennant or flag pattern in forex is a continuation pattern. They involve large movements that form a flagpole, followed by a consolation period where the asset stays in a range and has a weakening volume.

A breakout can occur when volume spikes and indicates a trend could continue in the direction of the original move, similar to a cup pattern in forex.
Ascending and Descending Triangle
An ascending triangle pattern in forex is formed during an uptrend and signals a continuation of a bullish move. It requires a horizontal line above the price candles, which acts as the resistance level.

Likewise, a descending triangle is formed during a downtrend, warning traders that the downward move is likely to continue. The horizontal line on descending forex triangle patterns will be below the price candles and form a support level.
Rectangles
When you learn how to analyze forex charts, you will frequently encounter rectangle patterns. They're formed when significant support and resistance levels are respected, creating a box.

A rectangle pattern signals a pause to the current move and shows a battle taking place between buyers and sellers. As a continuation pattern, it's typically followed by the asset resuming a move in the original direction of the trend.
Rising and Falling Wedges
Wedges can be continuation or reversal forex patterns based on when they occur. Neutral wedges are typically categorized as symmetrical triangles as they lack the direction to form an actual wedge.
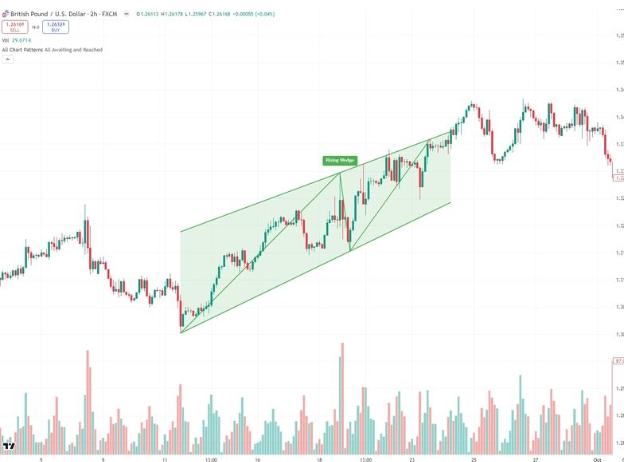
A rising wedge shows buyers are losing momentum, indicating a reversal during an uptrend or a continuation during a downtrend. Similarly, a falling wedge shows that sellers lack strength, signalling a reversal during a downtrend or a continuation during an uptrend.
Essential Neutral Chart Patterns
Neutral chart patterns highlight a pause in the current trend where the asset will trade sideways for a period. They don't provide traders with an indication of which direction the price will move following a breakout.
Symmetrical Triangle
A symmetrical triangle or coil pattern is formed when two trend lines converge at a central point.

An asset's price typically moves between the upper and lower bands, which tighten with time. A symmetrical triangle looks similar to other triangle or wedge patterns, which can make identification difficult.
Symmetrical triangles are neutral and don't tell traders which direction the asset will move. Therefore, waiting for a clear breakout above/below the triangle and confirmation is essential before taking a position.
How to Use Forex Patterns in Your FX Trading
Forex chart patterns are valuable when interpreting the market as they hint at its direction. It's essential to check for multiple patterns to see if they contradict each other and whether the idea is supported in different time frames.
You'll need a broker to trade. STIC Cashback's promotion offers a special bonus for registering your broker account through the platform.
Developing proper forex trading strategies that consider multiple factors outside of chart patterns is also crucial. Using technical indicators like RSI, moving average, and Bollinger bands alongside chart patterns is recommended as they help improve reliability.
Although using a forex pattern can improve your trading success rate, they're not infallible. As such, you should employ risk management strategies to help mitigate losses. Setting up stop-loss orders is a good way to exit a trade automatically if it goes awry.
Common Mistakes When Using Forex Chart Patterns
Although using forex patterns can improve your performance, people using them often make a few common mistakes.
Seeing forex chart patterns when there are none, or overfitting, is one of the most common mistakes people make, often because they're attempting to force a trade instead of waiting for the right time. However, you can practice identifying patterns on a demo account to learn without risk.
Another typical error people make is trading a pattern without waiting for confirmation. Waiting for an additional confirmation or breakout after a pattern provides a buy/sell signal helps to improve your performance.
Often, people trade without considering the broader economy or market conditions. However, significant global events like war or declining economies play a vital role in the value of currency pairs. Likewise, knowing factors like whether the market is trending upward or downward is crucial.
Always consider the time frame when analyzing patterns, as failing to do so can lead to positions being held for too long or closed early. Moreover, it helps to use technical indicators alongside patterns to help confirm a potential trade and increase its success rate.
Explore Other Forex Guides
Willingness to learn is a critical aspect of trading. You can read more about forex with the following guides:
Chart Patterns Forex FAQs
Do Forex Trading Patterns Work?
Forex trading patterns are effective for increasing trading success rates. They hint at how the market could move. However, trading patterns are not perfect and can produce incorrect signals. As such, they're best used alongside technical indicators which improve overall performance.
What Are the Most Common Forex Patterns?
There are three main types of trading patterns: reversal, continuation, and neutral. The most commonly used patterns include head and shoulders, triangles, engulfing, and hammers. It helps to test various patterns to see which best suits your strategy.
How Do You Read Forex Patterns?
Reading chart patterns can be challenging. Some look very similar to each other but have vastly different meanings. As such, it's vital to practice reading patterns by looking at historical charts or using a demo account.
How Many Forex Trading Patterns Are There?
There are over 1,000 chart patterns in forex. Experienced individuals regularly develop new patterns, but only a fraction become widely used. It can help to learn about popular patterns before branching into more niche options.